Design and modelling of adsorption chromatography based on isotherm data
Adsorption systems are most commonly set-up as packed beds. However, in some cases stirred batch adsorption contactors are used and this provides a logical starting point for the consideration of adsorption design and modelling. In fact many modelling approaches for adsorption column design are based on constants determined from data obtained in stirred tank experiments i.e. isotherm data.
Stirred tank (batch adsorption)
Equilibrium considerations
The mass balance for a well mixed vessel containing a fixed adsorbate charge with a fixed amount of suspended adsorbent can be formulated to give the equilibrium concentration of adsorbate remaining in solution:
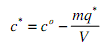
where c0 is the initial or total adsorbate concentration in the tank
m is the amount of adsorbent used (units can be either volume or mass but must consistent with q*)
q* is the equilibrium concentration of adsorbate on the adsorbent
V is the total tank volume (liquid + adsorbent)
The design equation for the adsorber is given by combining the mass balance with the appropriate binding isotherm. Using the Langmuir form this gives:
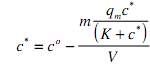
solving c* gives a quadratic with the physically meaningful root.
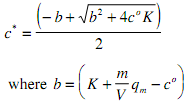
A similar relation ship can be derived for q* such that both the occupied adsorbent capacity and the adsorbate concentration remaining in solution at equilibrium can be determined. It should be stressed that an adsorption isotherm is the relationship between q* and c*, not q* and co.
A graphical solution of this problem can also be constructed. Solving the mass balance equation for q*:
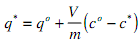
where qo is the adsorbate capacity which is occupied prior to a change of conditions (normally zero for loading)
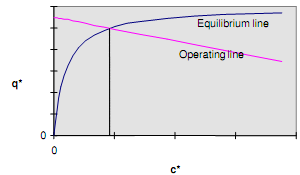
This represents the operating line which will be linear. The intersection of the operating line with the equilibrium line gives the equilibrium conditions which will result from the initial conditions chosen.
Modelling as a series of batch adsorption stages
In reaction engineering it is common practice to relate a plug flow reactor to a series of well mixed vessels. As an adsorption is analogous to a chemical reaction a similar approach can be used for an adsorption column. The column can be divided in to n reaction vessels such that the residence time in each vessel can be calculated from vessel height voidage and linear velocity. The feed is treated incrementally as elements equivalent to the flow velocity multiplied by the tank residence time.
Using the batch adsorption relationship derived earlier it is possible to calculate the bound adsorbate concentration for the stage residence time.
Rate Modelling
While equilibrium calculations are useful in providing preliminary estimates of adsorbent capacities and comparative assessments of resin suitability, any realistic design calculations must take account of process kinetics and mass transfer. The most common model applied here is described as a General Rate Model.
This case study will look at obtaining a first estimate of adsorption performance from isotherm data for batch and packed bed systems.
i) Adsorption Isotherm
An initial set of isotherm experiments have been performed to determine suitable conditions for an adsorption process. Isotherms were performed using 100mL of protein solution (1g/l) and varying amounts of adsorbent (beads). The first experiment gave rise to this dataset:
c* (g/l) Beads (ml)
0.9 0.4
0.8 0.8
0.7 1.25
0.6 1.75
0.5 2.2
0.4 2.9
0.3 3.6
0.2 5
0.1 8
0.05 15
The data has been fitted with this isotherm: Langmuir Isotherm qm - 30g/l, KD - 0.15g/l
Plot an isotherm (c* - x axis, q* - y axis) for the data given and for the equation given over the range of the data.
Further experiments at differing conditions gave rise to the isotherms given below:
qm - 30g/l, KD - 0.01g/l
qm - 30g/l, KD - 1.0g/l
ii) Batch adsorption:
Using the 3 Langmuir isotherms given in (i) calculate the yields for a batch adsorption system. Base the calculation on 20L of protein solution (1g/l) and 1l of adsorbent (the adsorbent is hydrated in buffer and has a total mass of 1kg), assume all material adsorbed can be successfully recovered.
iii) Packed Bed adsorption:
By considering the adsorbent as 4 (250ml) stirred tank reactors (STRs) in series (each reaching equilibrium), setup a model of a packed bed adsorption process in an Excel spreadsheet. Use the 3 Langmuir isotherms from previous sections to plot three simulated breakthrough curves (again the starting material is 1g/l protein, 40l of which is loaded onto the column). Using these plots calculate the yield for a packed bed adsorption system after 20L of load.